
Training Metrics: 20 Ways to Measure Employee Training Success

You spend time and money on training. But how do you know it works? Many teams track only one thing: how many people finished the course. That number is useful, but it does not tell you if people learned anything, if they use what they learned, or if the business got better because of it.
- Training metrics are numbers that show if your training is working, from who takes part to what the business gains.
- Group your metrics into five areas: engagement, learning, learner experience, behavior, and business impact.
- Completion rate alone is not enough. Add test scores, skill use on the job, and business results.
- The Kirkpatrick Model (4 levels) and Phillips ROI Model give your metrics a clear structure.
- Training ROI = (Benefits − Costs) ÷ Costs × 100. The hard part is putting a money value on results.
- Start with 5 to 8 metrics tied to one clear business goal, measure a baseline, and review on a set schedule.
You spend time and money on training. But how do you know it works? Many teams track only one thing: how many people finished the course. That number is useful, but it does not tell you if people learned anything, if they use what they learned, or if the business got better because of it.
This is where training metrics help. The right numbers show you what is working, what is not, and where to put your budget next. In this guide, you will learn what training metrics are, the 20 most useful ones to track, simple formulas for each, and a step-by-step way to measure your training programs.
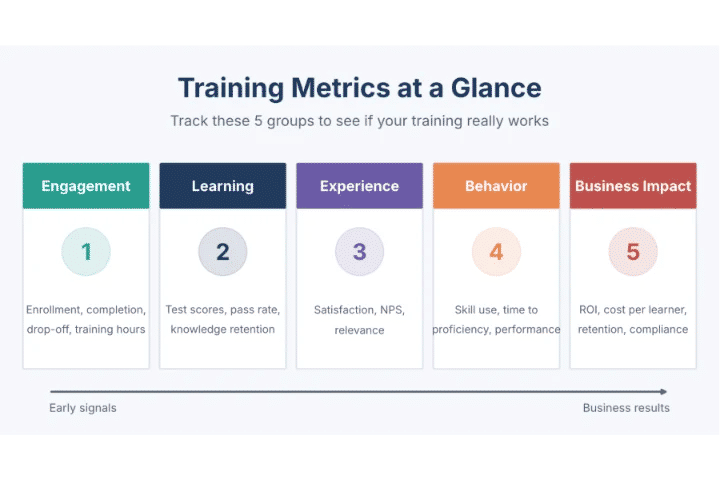
What Are Training Metrics?
Training metrics are numbers that show how well your training programs are doing. They measure things like how many employees take part, how much they learn, how they use new skills at work, and what the training does for the business.
Some metrics are simple counts, like the number of people who enrolled. Others take more work, like training ROI, which compares the money you spent with the money you gained. Together, they give you a full picture of your learning programs from start to finish.
You may also hear the terms training and development metrics, L&D metrics, or learning metrics. They all mean much the same thing. Employee training metrics is a narrower term that usually points to the training your staff take for their jobs, such as onboarding, compliance, product and skills training.
Training Metrics vs. KPIs vs. Learning Analytics
These three terms are often mixed up. Here is a simple way to tell them apart:
Term | What it means | Example |
Training metric | Any number you track about training | Course completion rate is 82% |
Training KPI | A metric tied to a clear goal and target | Reach 95% completion of safety training by June |
Learning analytics | The process of studying the data to find patterns and make decisions | Finding that learners drop off at module 3 because it is too long |
In short, every KPI is a metric, but not every metric is a KPI. Analytics is what you do with the numbers.
Why Training Metrics Matter
Without data, training decisions are based on guesses. With good training metrics, you can:
- Prove the value of training. Leaders want to know what they get for the money. Clear numbers make it easier to defend and grow your budget.
- Find what is not working. If people drop out of a course or fail the same quiz question, you can fix the content fast.
- Link learning to business goals. Metrics show how training helps with sales, customer service, safety, or employee retention.
- Make training better for learners. Feedback scores tell you what employees enjoy and what they find boring or not useful.
- Stay compliant. For required courses, tracking who finished and when keeps you ready for audits.
- Plan smarter. Data helps you decide which programs to keep, change, or stop.
Put simply, training metrics turn training from a cost into something you can measure and improve.
Popular Frameworks for Measuring Training
Before you pick metrics, it helps to know the two models most L&D teams use. They give your metrics a clear structure.
The Kirkpatrick Model
The Kirkpatrick Model is the most widely used way to judge training. It has four levels. Each level builds on the one before it.
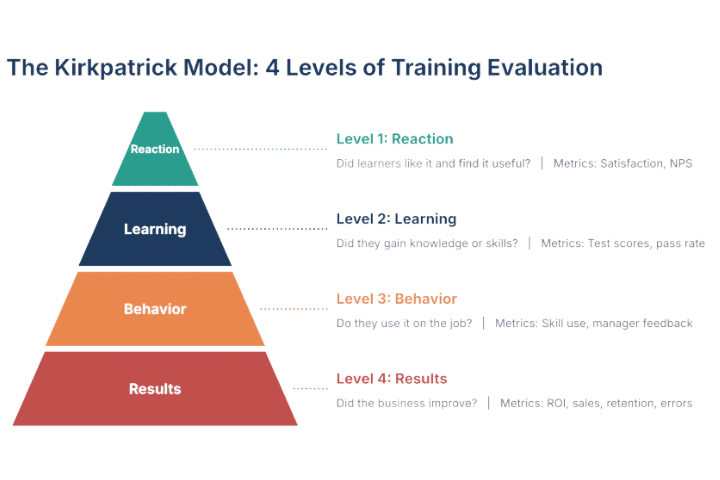
- Level 1 – Reaction: How did learners feel about the training? Was it useful and engaging?
- Level 2 – Learning: Did learners gain new knowledge or skills? This is usually checked with tests.
- Level 3 – Behavior: Are people using what they learned in their daily work?
- Level 4 – Results: Did the training improve business results, such as sales, quality, or retention?
Most companies measure Levels 1 and 2 well, because the data is easy to collect. Levels 3 and 4 are harder but show the real impact.
The Phillips ROI Model
The Phillips ROI Model adds a fifth level to Kirkpatrick: return on investment (ROI). It turns business results into money and compares that with what the training cost. This is helpful when you need to show leaders a clear financial return.
You do not need to use every level for every course. A short policy update may only need completion and quiz scores. A large leadership program is worth measuring all the way to ROI.
20 Training Metrics to Track
Below are 20 key training metrics, grouped into five areas. For each one, you will find what it means, how to work it out, and why it matters. You do not need to track all of them. Pick the ones that fit your goals.
Engagement and Participation Metrics
These metrics show whether employees are showing up and taking part. They are the first signals of a healthy program.
1. Enrollment Rate
What it is: The share of invited employees who sign up for a course.
Formula: Enrollment rate = (Employees enrolled ÷ Employees invited) × 100
Why it matters: A low rate may mean the course is not well promoted, not seen as useful, or hard to find.
2. Course Completion Rate
What it is: The share of enrolled learners who finish the course. This is one of the most common employee training metrics.
Formula: Completion rate = (Learners who completed ÷ Learners enrolled) × 100
Why it matters: A high rate shows people find the course worth finishing. For required courses, such as compliance training, you should aim for close to 100%.
3. Drop-off Rate
What it is: The share of learners who start but do not finish. It also helps to know where they leave.
Formula: Drop-off rate = (Learners who left ÷ Learners who started) × 100
Why it matters: If many people leave at the same module, that part may be too long, too hard, or not relevant.
4. Training Hours per Employee
What it is: The average time each employee spends in training over a set period.
Formula: Training hours per employee = Total training hours ÷ Number of employees
Why it matters: It shows how much your company invests in learning. Compare it across teams to spot groups that get too little training.
5. Learner Engagement Rate
What it is: How active learners are inside the training. This can include logins, video views, quiz attempts, comments, and time on page.
Formula: Engagement rate = (Active learners ÷ Total enrolled learners) × 100
Why it matters: Completion tells you if they finished. Engagement tells you if they paid attention along the way.
Learning and Knowledge Metrics
These metrics answer a simple question: did people actually learn something?
6. Assessment Scores (Pre- and Post-Training)
What it is: The scores learners get on tests before and after training.
Formula: Knowledge gain = Average post-test score − Average pre-test score
Why it matters: Testing before and after shows real learning, not just what people already knew.
7. Pass Rate
What it is: The share of learners who pass the final test or certification.
Formula: Pass rate = (Learners who passed ÷ Learners who took the test) × 100
Why it matters: Also track first-attempt pass rate. If many people need three tries, the content or the test may need work.
8. Knowledge Retention Rate
What it is: How much learners remember weeks or months after training.
Formula: Retention rate = (Score on follow-up test ÷ Score on post-test) × 100
Why it matters: People forget fast without practice. Short quizzes after 30 or 90 days show if knowledge sticks. Use this to plan refresher lessons.
6. Assessment Scores (Pre- and Post-Training)
What it is: The scores learners get on tests before and after training.
Formula: Knowledge gain = Average post-test score − Average pre-test score
Why it matters: Testing before and after shows real learning, not just what people already knew.
Learner Experience Metrics
These metrics match Level 1 of the Kirkpatrick Model. They tell you how employees feel about the training.
9. Learner Satisfaction Score
What it is: How happy learners are with the course, usually rated on a 1–5 scale in a short survey.
Formula: Satisfaction score = Total of all ratings ÷ Number of responses
Why it matters: Happy learners are more likely to finish, pay attention, and join future courses.
10. Training Net Promoter Score (NPS)
What it is: How likely learners are to recommend the course to a co-worker, on a 0–10 scale.
Formula: NPS = % of promoters (9–10) − % of detractors (0–6)
Why it matters: It is a quick, easy-to-compare score. Add an open question such as “What would make this course better?” to learn why.
11. Training Relevance Score
What it is: How useful learners think the training is for their job.
Formula: Ask: “How useful is this training for your daily work?” and average the answers
Why it matters: A course can be fun but not useful. This score tells you if content matches real job needs.
Behavior and Performance Metrics
These metrics show if learning turns into action at work. They match Level 3 of the Kirkpatrick Model and matter most to managers.
12. Skill Application Rate
What it is: The share of learners who use the new skill on the job.
Formula: Skill application rate = (Learners using the skill ÷ Learners trained) × 100
Why it matters: Collect this through manager check-ins, self-reports, or work samples 30 to 90 days after training.
13. Time to Proficiency
What it is: How long it takes a new hire or newly trained employee to reach full performance.
Formula: Time to proficiency = Date of reaching target level − Start date
Why it matters: Shorter time means people add value sooner. This is a key metric for employee onboarding programs.
14. Employee Performance Change
What it is: The change in job results before and after training, such as sales numbers, call handling time, or error rates.
Formula: Performance change = (Result after − Result before) ÷ Result before × 100
Why it matters: This links training straight to work output. Use a control group if you can, so you know the change came from training.
15. Manager and Peer Feedback
What it is: Ratings from managers or co-workers on how an employee’s behavior has changed after training.
Formula: Average manager rating after training vs. before training
Why it matters: Managers see daily work, so their view adds proof that numbers alone cannot give.
Business Impact Metrics
These are the metrics leaders care about most. They match Level 4 of Kirkpatrick and Level 5 of the Phillips model.
16. Training ROI
What it is: The money the business gained from training compared with what it cost.
Formula: Training ROI = (Benefits − Costs) ÷ Costs × 100
Why it matters: This is the clearest way to show training is worth the money. See the full example in the next section.
17. Cost per Learner
What it is: The average amount you spend to train one employee.
Formula: Cost per learner = Total training cost ÷ Number of learners
Why it matters: Include design, tools, trainer fees, travel, and the time employees spend away from work. Use it to compare the cost of different formats, such as online vs. classroom.
18. Employee Retention Rate
What it is: The share of employees who stay with the company over a set period, compared between trained and untrained groups.
Formula: Retention rate = (Employees at end of period ÷ Employees at start) × 100
Why it matters: People are more likely to stay when they get chances to grow. Lower turnover saves hiring and onboarding costs.
19. Compliance Rate
What it is: The share of employees who complete required training on time.
Formula: Compliance rate = (Employees compliant ÷ Employees required) × 100
Why it matters: Missing required training can lead to fines, safety issues, or failed audits.
20. Internal Promotion Rate
What it is: The share of open roles filled by current employees.
Formula: Internal promotion rate = (Roles filled internally ÷ Total roles filled) × 100
Why it matters: It shows if your training and development programs are building future leaders and skills from within.
Training Metrics Cheat Sheet
Here is a quick summary of which metric answers which question:
| Question you want to answer | Metrics to use |
| Are people taking the training? | Enrollment rate, completion rate, drop-off rate |
| Are they engaged? | Engagement rate, training hours per employee |
| Did they learn? | Assessment scores, pass rate, knowledge retention |
| Did they like it? | Satisfaction score, NPS, relevance score |
| Are they using it at work? | Skill application, time to proficiency, manager feedback |
| Did the business benefit? | ROI, cost per learner, retention, compliance, internal promotion |
How to Calculate Training ROI (With Example)
Training ROI sounds hard, but the math is simple. The tricky part is putting a money value on the results.
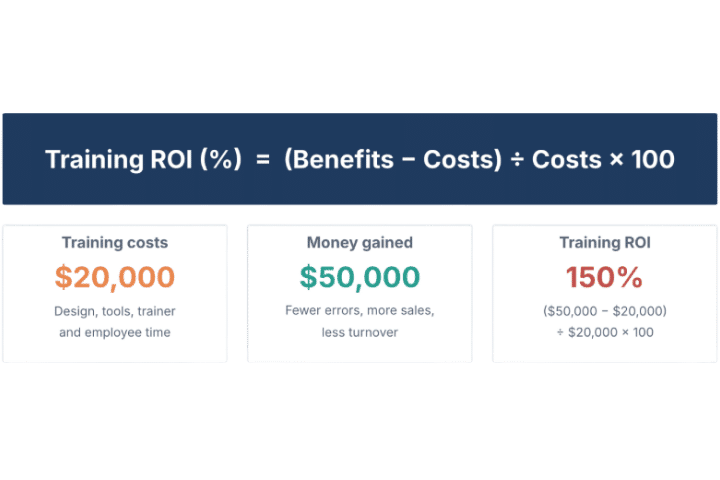
Step 1: Add up all training costs. Include course design, software, trainer fees, materials, travel, and the paid time employees spend in training.
Step 2: Measure the business benefits. Look at the results the training was meant to change. For example, fewer mistakes, faster work, higher sales, or lower turnover.
Step 3: Turn the benefits into money. If errors dropped by 200 a month and each error costs $25 to fix, the training saves $5,000 a month.
Step 4: Use the formula. Say the training cost $20,000 and saved $50,000 in a year. ROI = ($50,000 − $20,000) ÷ $20,000 × 100 = 150%. That means every $1 spent returned $1.50 on top of the original dollar.
Tip: Be honest about other factors. If sales went up during a busy season, not all of the gain came from training. Comparing trained and untrained groups helps you get a fair number.
How to Measure Training Effectiveness in 6 Steps
Knowing the metrics is only half the job. Here is a simple process to measure any training program.
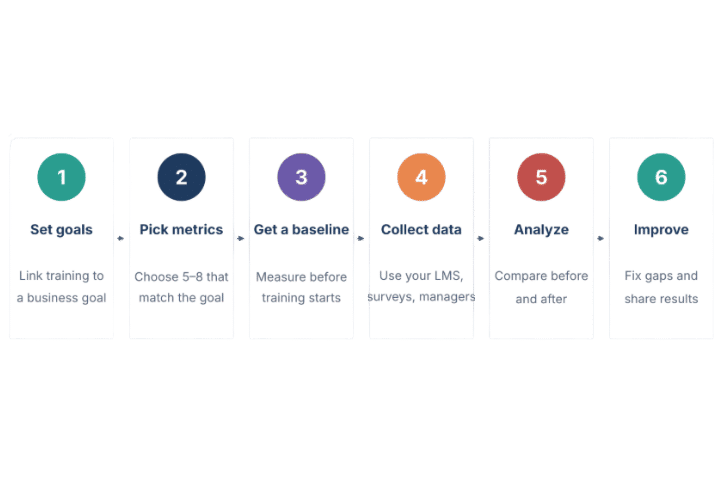
Step 1: Start With a Clear Goal
Ask what the business needs to change. “Train the support team” is not a goal. “Cut average ticket time from 12 minutes to 9 minutes in three months” is. A good training needs analysis helps you find the right goal.
Step 2: Pick 5 to 8 Metrics That Match the Goal
Choose a mix from each level: one or two for engagement, one or two for learning, and at least one for behavior and business results. Too many metrics make reports hard to read.
Step 3: Get a Baseline Before Training
You cannot show change if you do not know where you started. Record current performance, run a pre-test, and note costs before the course begins.
Step 4: Collect Data From the Right Sources
Most engagement and test data comes from your learning management system (LMS). Use surveys for feedback, manager check-ins for behavior, and HR or business systems for results like sales or turnover.
Step 5: Analyze and Compare
Compare before and after numbers. Look at results by team, role, or location. If you can, compare a trained group with a group that has not been trained yet.
Step 6: Act on the Results and Share Them
Use the data to fix weak spots, update content, or drop courses that do not work. Then share a short, clear report with leaders. Show the goal, what changed, and what you will do next.
How to Choose the Right Training Metrics
Not every metric fits every program. Use these simple rules to pick the right ones:
- Match the metric to the training type. Compliance training needs completion and compliance rates. Sales training needs performance and revenue data. Onboarding needs time to proficiency.
- Ask what your leaders care about. If your CEO is worried about turnover, show how training affects retention.
- Make sure you can get the data. A great metric is useless if you cannot collect it. Start with what your systems already track.
- Mix early and late signals. Engagement shows up in days. Business results can take months. Track both so you are not waiting too long for answers.
- Keep it simple. A few clear numbers that people understand beat a long list nobody reads.
Here is an example of how this looks for different programs:
Training program | Main goal | Best metrics to track |
New hire onboarding | Get people productive faster | Completion rate, time to proficiency, 90-day retention |
Compliance training | Meet legal rules on time | Compliance rate, completion rate, pass rate |
Sales training | Grow revenue | Performance change, skill application, ROI |
Leadership training | Build future leaders | Manager feedback, internal promotion rate, retention |
Customer service training | Improve service quality | Customer satisfaction, handling time, knowledge retention |
Common Challenges in Tracking Training Metrics (and How to Fix Them)
Most L&D teams run into the same problems. Here is how to deal with them.
1. Focusing only on completion. Completion is easy to track, so many teams stop there. Fix: add at least one learning metric and one behavior metric to every major program.
2. Data spread across many tools. Course data sits in the LMS, feedback in survey tools, and results in HR or sales systems. Fix: use a platform that brings this data together, or set up a simple shared report.
3. Hard to prove training caused the result. Many things affect performance. Fix: use baselines, compare trained and untrained groups, and ask managers what changed.
4. Low survey response rates. People skip long surveys. Fix: keep surveys to three to five questions and send them right after the course ends.
5. Measuring too late. If you only check results at the end of the year, it is too late to fix anything. Fix: track early signals like engagement and quiz scores weekly.
Best Practices for Tracking Training and Development Metrics
- Plan measurement before you build the course. Decide what success looks like first, then design the training to reach it.
- Use both numbers and stories. Data shows what happened. Learner and manager comments explain why.
- Review metrics on a set schedule. Check engagement weekly, learning monthly, and business impact every quarter.
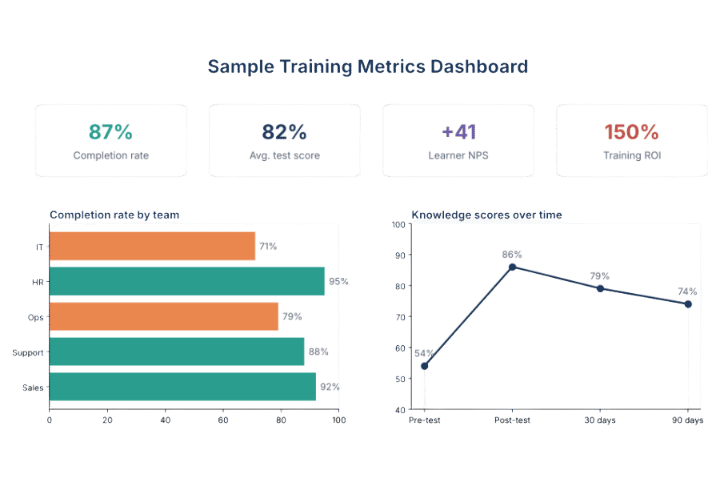
- Build a simple dashboard. Put your key training and development metrics in one place so everyone sees the same numbers.
- Segment your data. Look at results by team, location, role, and format. Averages can hide problems.
- Share wins. When a program works, tell leaders and learners. It builds support for future training.
- Keep improving. Treat every course as something you can make better with each round of data.
Tools to Track Employee Training Metrics
You can track a few metrics in a spreadsheet, but it gets hard as your programs grow. Most companies use a mix of tools:
- Learning management system (LMS): tracks enrollment, completion, time spent, test scores, and certificates automatically.
- Survey tools: collect satisfaction, NPS, and relevance scores.
- HR systems: hold data on retention, promotions, and performance reviews.
- Business tools: CRM, help desk, and finance systems hold sales, service, and cost data you need for ROI.
- Reporting dashboards: pull it all together so you can see trends at a glance.
A good LMS is the base of any training data setup. Look for one with built-in reports, custom dashboards, automatic reminders, and easy links to the tools your team already uses.
Conclusion
Training only matters if it changes something. Training metrics help you see that change. Start with a clear business goal, pick a small set of metrics that cover engagement, learning, behavior, and results, and measure before and after.
You do not need to track all 20 metrics on day one. Begin with three to five, build a simple dashboard, and add more as your programs grow. Over time, these employee training metrics will help you build better courses, earn more support from leaders, and grow a stronger workforce.
Join Our Creative Community
Frequently Asked Questions
What are the most important training metrics?
The most important ones depend on your goal, but a good starting set is completion rate, assessment scores, learner satisfaction, skill application, and training ROI. Together, they cover all four Kirkpatrick levels.
How do you measure employee training effectiveness?
Set a clear goal, get a baseline, pick metrics that match the goal, collect data before and after training, and compare the results. Use tests for learning, manager feedback for behavior, and business data for results.
What is a good course completion rate?
For required training, aim for 90–100%. For optional courses, many companies see 20–60%. Compare your rate with your own past results rather than a single industry number.
How often should I review training metrics?
Check engagement weekly, learning results after each course, and business impact every quarter. Long programs, such as leadership training, may need a review six to twelve months later.
What is the difference between training metrics and training KPIs?
A training metric is any number you track. A KPI is a metric tied to a specific goal and target, such as reaching 95% completion of safety training by the end of the quarter.