
Helpdesk KPI and Metrics: Track What Improves Support

Helpdesk KPIs show whether a support team is responding quickly, resolving issues correctly, meeting service commitments, and giving employees or customers a dependable support experience.
The right measures help IT leaders find delays, workload problems, repeat issues, and service gaps before they become larger business problems.
- Track key Helpdesk KPIs to measure support performance.
- Monitor response time, SLA, backlog, and customer satisfaction.
- Use helpdesk performance metrics to identify service gaps.
- Improve workflows, automation, and ticket resolution using KPI insights.
- Helpdesk 365 helps support teams track and improve results.
Tracking everything is not the goal. Strong helpdesk measurement focuses on the numbers that explain performance and point toward a specific action.
What Is a Helpdesk KPI?
A helpdesk KPI is a key performance indicator used to measure whether a support team is achieving an important service objective. It connects ticket data to a target such as faster response, better resolution, stronger SLA compliance, lower support cost, or higher user satisfaction. Examples include first response time, first contact resolution, backlog, resolution time, and customer satisfaction.
A metric becomes valuable when it answers a management question.
For example, “1,200 tickets were closed this month” describes activity. “94% of priority-one tickets were resolved within the agreed SLA” shows whether the team met a service commitment.
Helpdesk KPIs vs. Metrics: What's the Difference?
Helpdesk metrics measure activity, while Helpdesk KPIs measure performance against an important goal. Ticket volume, open tickets, and handling time are metrics. When one of those measurements is connected to a target, business outcome, or service commitment, it becomes a KPI. Every KPI is a metric, but not every metric needs executive attention.
| Area | Metric | KPI |
| Ticket demand | 1,500 tickets created | Keep backlog below the team’s agreed threshold |
| Response | 35-minute average response | Meet response SLA for 95% of priority tickets |
| Quality | 42 tickets reopened | Keep reopen rate below the defined target |
| Experience | 4.3 average rating | Maintain CSAT at or above the service goal |
Why Are Helpdesk KPIs Important?
Imagine an IT head hears that employees are unhappy with support. Ticket volume appears normal, and agents are closing requests every day. Without deeper measures, the problem is difficult to locate.
A KPI review may show that first responses are fast, but resolution time has increased for access requests because approvals sit untouched for hours. The team does not need to “work faster.” The approval process needs attention.
Useful Helpdesk KPIs help organizations:
- detect growing backlog before service quality drops;
- identify request types that repeatedly miss SLAs;
- understand whether staffing matches ticket demand;
- find categories that create repeat work;
- measure whether users receive complete resolutions;
- expose delays between teams or approval stages;
- evaluate whether automation reduces manual effort;
- support staffing and technology decisions with evidence.
MetricNet’s service desk benchmarking framework includes cost per contact, first contact resolution, customer satisfaction, agent utilization, average speed of answer, and self-service completion among its core service desk measures.
How Do Helpdesk KPIs Work?
Start with a service goal, choose the measurement that reflects it, define exactly how it is calculated, set a target, assign an owner, and review the result on a fixed schedule. Then segment the data, investigate changes, take corrective action, and measure again. This turns helpdesk reporting into an ongoing improvement process rather than a monthly reporting exercise.
For example, suppose average resolution time rises from six hours to ten hours.
Do not immediately conclude that agents are slower. Break the KPI down by priority, category, department, assignee, and ticket age. You may find that hardware requests are waiting for procurement while every other category remains stable.
12 Helpdesk KPIs to Track
The 12 Helpdesk KPIs most teams should consider are ticket volume, backlog, first response time, average resolution time, first contact resolution, SLA compliance, reopen rate, escalation rate, customer satisfaction, cost per ticket, agent workload, and self-service success. Together, these measures cover demand, speed, quality, efficiency, capacity, and user experience.
1. Ticket Volume
Ticket volume is the number of new requests created during a defined period.
Track it by day, week, month, department, category, and priority. A sudden increase can reveal a software outage, policy change, onboarding wave, or recurring technical issue.
2. Ticket Backlog
Ticket backlog is the number of unresolved requests still waiting for action or completion.
Do not measure backlog only as one total. Track ticket age as well.
3. First Response Time
First response time measures how long a requester waits before receiving the first meaningful reply from support.
Formula: Total first-response time divided by answered tickets.
4. Average Resolution Time
Average resolution time shows how long tickets take to move from creation to completed resolution.
Formula: Total resolution time divided by resolved tickets.
5. First Contact Resolution
First contact resolution, or FCR, measures the percentage of eligible issues solved during the first interaction without additional contact or escalation.
Formula: Tickets resolved on first contact divided by eligible tickets, multiplied by 100.
HDI defines FCR around resolving the user’s issue during the initial interaction and notes that follow-up or escalation generally means the contact does not qualify.
MetricNet’s current site shows a Q3 2025 technology and software peer-group example with 72% first contact resolution across 35 companies. Treat that as a peer reference, not a universal target for every helpdesk.
6. SLA Compliance
SLA compliance measures how often tickets meet agreed response or resolution commitments.
Formula: Tickets completed within SLA divided by tickets covered by SLA, multiplied by 100.
Segment SLA results by priority and service type. A 95% overall result can still hide serious breaches if low-priority tickets dominate the total.
7. Reopen Rate
Reopen rate shows how often previously resolved tickets return to active status.
Formula: Reopened tickets divided by resolved tickets, multiplied by 100.
8. Escalation Rate
Escalation rate measures how frequently tickets move to another support level, specialist, manager, or department.
Formula: Escalated tickets divided by handled tickets, multiplied by 100.
9. Customer Satisfaction
Customer satisfaction, usually CSAT, measures how users rate the support experience after an interaction or resolution.
Formula: Positive survey responses divided by total survey responses, multiplied by 100.
MetricNet’s Q3 2025 technology and software peer-group example reports 81% customer satisfaction across 35 companies, showing why external benchmarks should be viewed in the context of a defined peer group.
10. Cost per Ticket
Cost per ticket estimates how much the organization spends to handle each support request.
Formula: Total helpdesk operating cost divided by total tickets handled.
11. Agent Workload
Agent workload shows how support demand is distributed across the team.
Compare active tickets, assigned tickets, ticket complexity, priority, and queue type. Raw ticket counts can be misleading because ten password resets are not equal to ten complicated infrastructure incidents.
12. Self-Service Success
Self-service success measures whether users can solve common problems through a knowledge base, portal, AI assistant, or guided workflow without requiring agent intervention.
Track successful self-service together with ticket creation, search behavior, escalations, and user feedback.
How Helpdesk 365 Helps Track and Improve KPIs
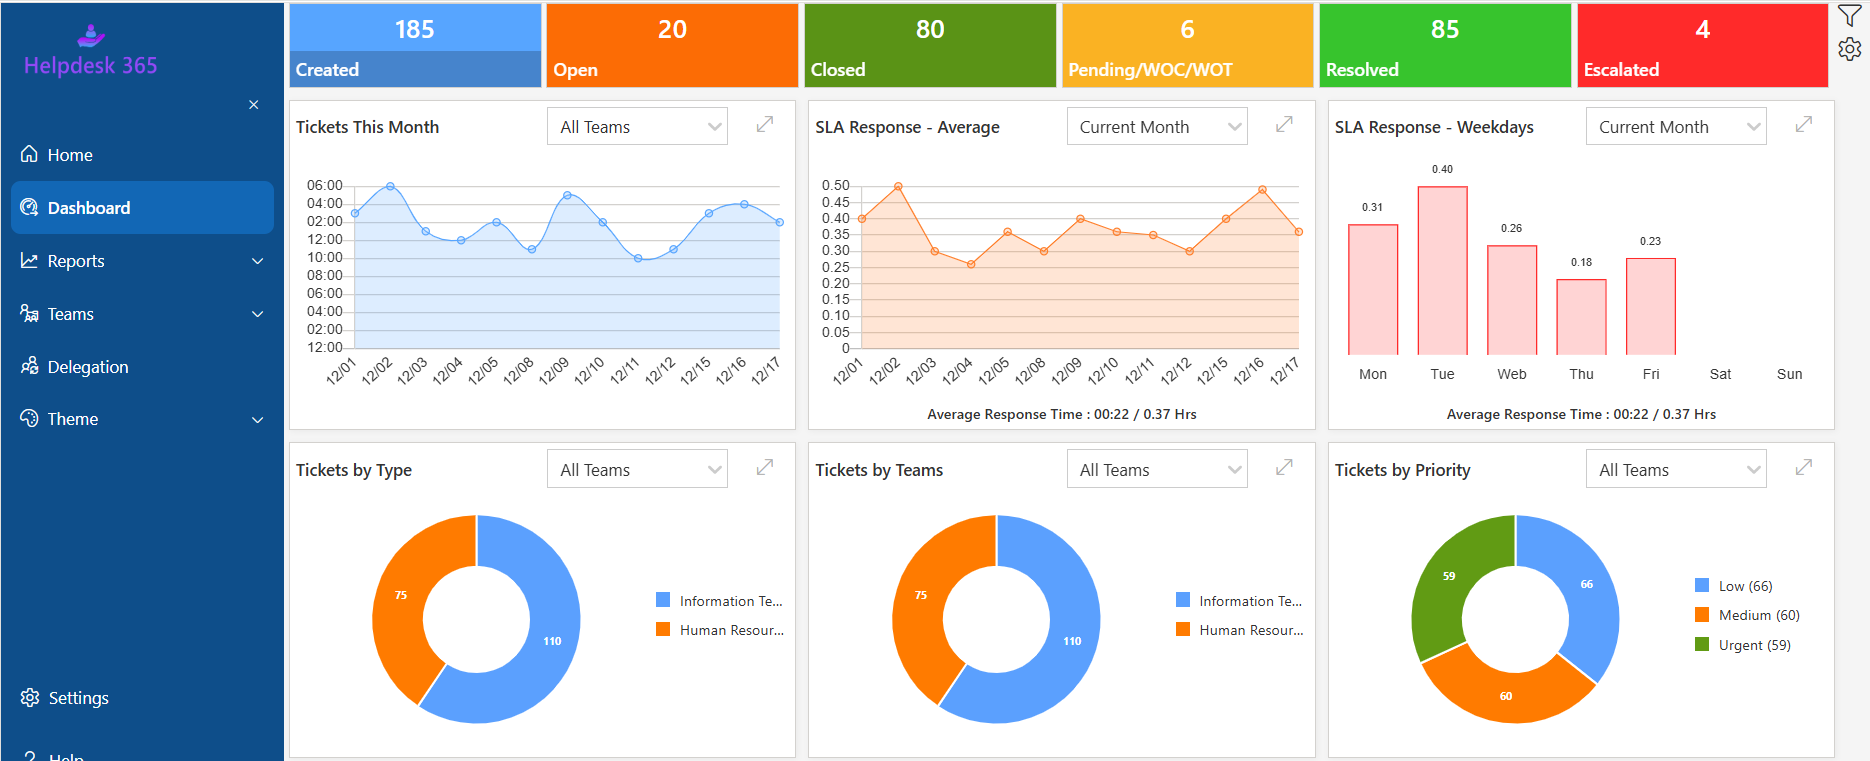
Once leaders choose the right KPIs, the next challenge is getting consistent data without manually combining spreadsheets, inboxes, and disconnected reports.
Helpdesk 365 provides reporting and analysis for ticket volume, response times, performance trends, and SLA activity. Its reporting features include dashboards, performance insights, and SLA reports designed to help teams identify gaps and monitor service performance.
If first response time rises, managers can investigate assignment and workload. If SLA breaches increase, alerts and escalation rules can bring at-risk tickets to the right people earlier. If repeat requests grow, the team can add knowledge content or automate a recurring workflow.
Helpdesk 365 also supports rules for ticket assignment, categorization, updates, notifications, approvals, reminders, and escalations.
Its SLA capabilities allow organizations to define response and resolution timelines by factors such as priority, ticket type, or department, while monitoring deadlines and triggering alerts when tickets are at risk.
That creates a practical cycle: measure the problem, change the workflow, and check whether the KPI improves.
Benefits of Tracking Helpdesk KPIs
The strongest benefit is visibility into what actually affects support performance.
A scorecard also separates leading indicators from lagging outcomes. Rising ticket age, growing queue size, or increasing escalation can warn managers before satisfaction drops. CSAT and cost results often confirm what has already happened. Reviewing both types gives leaders time to intervene earlier, test a fix, and see whether service improves before a small operational problem becomes a business issue.
When the right KPIs helpdesk leaders choose are reviewed together, teams can:
- find service bottlenecks earlier;
- make staffing decisions using demand data;
- reduce repeated and avoidable work;
- improve accountability for aging tickets;
- identify training and knowledge gaps;
- protect service commitments;
- connect operational performance with user experience;
- show executives where support resources are producing value.
How to Use Helpdesk KPIs and Metrics
Start with a small scorecard tied to the outcomes your organization cares about.
Step 1: Define the business question.
Decide what you need to understand. Is support too slow? Are users returning with the same issue? Is one department creating unusual demand?
Step 2: Choose the matching KPI.
Select a measurement that answers the question directly.
Step 3: Define the calculation.
Document what starts and stops the clock, which tickets are included, and how exceptions are handled.
Step 4: Create a baseline.
Measure current performance before setting an aggressive target.
Step 5: Segment the result.
Break data down by priority, category, department, channel, location, or request type.
Step 6: Find the cause.
Look beyond the number. Ask what process, dependency, knowledge gap, or workload issue explains the change.
Step 7: Take action and measure again.
Change one controllable part of the process and check whether the result improves.
Helpdesk KPI Examples and Best Practices
Consider a company with 500 employees and a busy internal helpdesk. Management sees that 93% of tickets receive a first response within the target and assumes performance is strong.
Then the team reviews other Helpdesk KPIs.
Resolution time has increased. Reopen rate is climbing. Old tickets are concentrated in account-access requests.
The investigation reveals that agents respond quickly, but many requests wait for manager approval. Some tickets are also marked resolved before access is fully confirmed.
That example highlights several best practices:
- Pair speed with quality and outcome measures.
- Set different expectations for different priorities.
- Review trends instead of reacting to one unusual day.
- Track ticket age alongside total backlog.
- Compare averages with outliers and aging groups.
- Investigate causes before judging agent performance.
- Keep calculation rules consistent over time.
- Revisit targets after major process or staffing changes.
- Give every improvement action an owner.
- Measure the result after making a change.
HDI has also documented relationships among service desk measures, including the connection between first contact resolution and customer satisfaction and the influence of training and agent satisfaction on downstream performance.
How AI and Technology Improve Helpdesk KPI Tracking
AI can help support teams classify requests, summarize conversations, suggest answers, identify recurring themes, and route work based on ticket content.
Those capabilities can improve KPI tracking because cleaner categorization and consistent workflows produce better data.
AI can also help managers spot patterns that are difficult to see manually. A large ticket queue may contain repeated requests caused by the same policy, application update, or knowledge gap.
Do not celebrate a lower ticket count without checking what happened to users. An AI assistant may deflect requests because it solved them, or because users could not reach a human.
Track AI-related outcomes such as successful self-service, human handoff, reopen rate, user satisfaction, escalation, and resolution quality.
Helpdesk 365 includes AI assistance alongside ticket management, SLAs, a knowledge base, and workflow automation, allowing teams to connect technology improvements with the service measures they already monitor.
How to Choose a Helpdesk KPI Solution
Do not choose a helpdesk platform because its dashboard looks impressive during a sales demo.
Choose it based on whether managers can answer real operational questions.
Look for:
- dashboards that show current workload and trends;
- flexible filters by team, category, priority, and request type;
- response and resolution SLA tracking;
- aging and backlog visibility;
- clear assignment and ownership data;
- customer satisfaction reporting;
- automation connected to workflow problems;
- exportable reports for leadership review;
- permissions that protect operational data;
- integration with the tools employees already use.
For organizations working heavily in Microsoft 365, Helpdesk 365 can be evaluated when the goal is to manage support while keeping ticketing, reporting, automation, knowledge, and SLA processes connected to that environment.
Ask the vendor to show a critical overdue ticket, a recurring request, an approval-heavy request, a reassigned ticket, and a reopened issue. Then check whether the platform clearly shows what happened, who owns the next action, and which KPI changed.
Conclusion
Helpdesk KPIs should help leaders understand what is happening, why it is happening, and what to improve next.
The strongest approach combines measures for demand, response, resolution, SLA performance, quality, satisfaction, workload, cost, and self-service. Review them together so one attractive number cannot hide a weaker user experience.
Start with clear definitions and a reliable baseline. Segment the data, investigate changes, assign improvement actions, and measure again. Over time, the dashboard becomes more than a reporting screen; it becomes a practical management tool.
For Microsoft 365-based organizations, Helpdesk 365 brings ticket management, reporting, SLA tracking, rules, automation, knowledge, and AI-assisted support into one support approach. Its reporting capabilities provide visibility into ticket volume, response performance, trends, and SLA activity, while automation can help teams respond to the problems those numbers reveal.
Test the platform using the Helpdesk KPIs that matter most to your support team.
Join Our Creative Community
Frequently Asked Questions
What are the most important Helpdesk KPIs?
Common priorities include ticket volume, backlog, first response time, resolution time, first contact resolution, SLA compliance, reopen rate, escalation rate, customer satisfaction, cost per ticket, workload, and self-service success. The best set depends on your service goals and operating model.
How many Helpdesk KPIs should a team track?
There is no universal number. Start with a focused group that covers demand, speed, quality, user experience, and efficiency. Supporting metrics can remain available for investigation without becoming executive KPIs.
Should KPIs be tracked by individual agent?
Some agent-level measures help with coaching and capacity planning, but they need context. Ticket difficulty, shift, queue, priority, and dependencies can make simple rankings unfair and encourage rushed closures.
How often should Helpdesk KPIs be reviewed?
Operational measures such as backlog, workload, and SLA risk may need daily attention. Broader trends such as CSAT, cost, FCR, and recurring request patterns often become more meaningful over weekly or monthly periods.
Can one KPI measure overall helpdesk performance?
No. A single measure can create the wrong conclusion. Fast responses can coexist with slow resolutions. High closure counts can hide reopenings. Lower costs can come with poorer service. Use a balanced set that covers speed, quality, efficiency, capacity, and user outcomes.


_JiluXJRGNl.svg)