

Every finance team collects expense reports. Very few use it well.
- Spend analysis is the process of organizing and reviewing every dollar a business spends so leaders can spot waste, and plan budgets with real data instead of guesswork.
- Direct spend covers goods tied straight to production, while indirect spend covers operating costs like travel, software, and office supplies.
- Poor data quality, missing receipts, and manual entry are the top reasons spend analysis projects stall, and each one can be fixed with the right tools.
- A dedicated spend analysis solution, such as Expense 365, automates data capture and categorization so finance teams get clean reports.
According to GBTA Foundation research, roughly 19% of expense reports contain errors, and each one takes about 18 minutes and $52 to fix.
For a mid-size company processing thousands of reports a year, that adds up to close to half a million dollars in wasted labor every year. This is the exact gap that spend analysis is built to close.
Spend analysis is the process of collecting, cleaning, categorizing, and reviewing all company spending to find patterns, cut waste, and support better buying decisions.
This guide breaks down what the term means, how direct and indirect spend differ, how to run the process step by step.
What Is Spend Analysis?
Spend analysis is the practice of gathering data from every purchase a company makes invoices, purchase orders, corporate card statements, and employee expense claims and organizing that data so leaders can answer basic but important questions.
- How much did the company spend last quarter?
- Which vendors take the biggest share of the budget?
- Where is spend leaking outside approved contracts, and why?
At its core, this practice has three stages: data collection, data cleaning and categorization, and reporting. Skip any one of these steps and the output becomes unreliable.
Want to see what organized spend data looks like?
Book a free demo with Expense 365 and get a live walkthrough of a working spend analysis solution.
What Are Direct Spend and Indirect Spend in Spend Analysis? (With Examples)
Every spend review needs to separate purchases into two broad buckets: direct and indirect. They behave differently; they are controlled by different teams, and making them together in one report hides useful detail that leadership actually needs.
Direct spend: It covers purchases directly tied to producing a product or delivering a core service. This is spending a business cannot avoid without stopping production or halting delivery to a customer.
- Raw materials for manufacturing, such as steel for a car parts supplier
- Packaging materials for a consumer goods company shipping finished products
- Components purchased from third-party suppliers for assembly on a production line
Indirect spend: It covers everything that keeps the business running but is not part of the finished product. This is the category most programs focus on first, since it is often less controlled, harder to see immediately.
- Employee travel and hotel bookings for client meetings and conferences
- Software subscriptions, cloud services, and other IT costs
- Office supplies, utilities, and general facilities costs
- Marketing services and outside consulting fees
For example, a logistics company’s fuel and vehicle parts count as direct spend, since they are needed to deliver the core service the customer is paying for. That same company’s spend on a project management tool, expense reimbursement, and consulting fees for a compliance audit.
How to Do Spend Analysis?
Running this process well follows a repeatable sequence. Skipping steps, or rushing through them to save time, is the fastest way to end up with numbers nobody on the leadership team trusts.
- Collect the data: Pull transaction data from every source: ERP systems, corporate card feeds, procurement platforms, and expense management software.
- Clean the data: Remove duplicates, fix mismatched vendor names, and fill in missing fields. This step alone often takes the most time in a manual process, since data rarely arrives in one consistent format.
- Categorize the spend: Group transactions into standard categories so comparisons across time periods and departments are possible.
- Analyse patterns: Look at spend by supplier, department, category, and period to find outliers, savings opportunities, and off-contract purchases.
- Report and act. Share findings with department heads and finance leadership, then set clear targets for the next review cycle so the exercise leads to a decision, not just a slide deck.
How Is Spend Data Categorized?
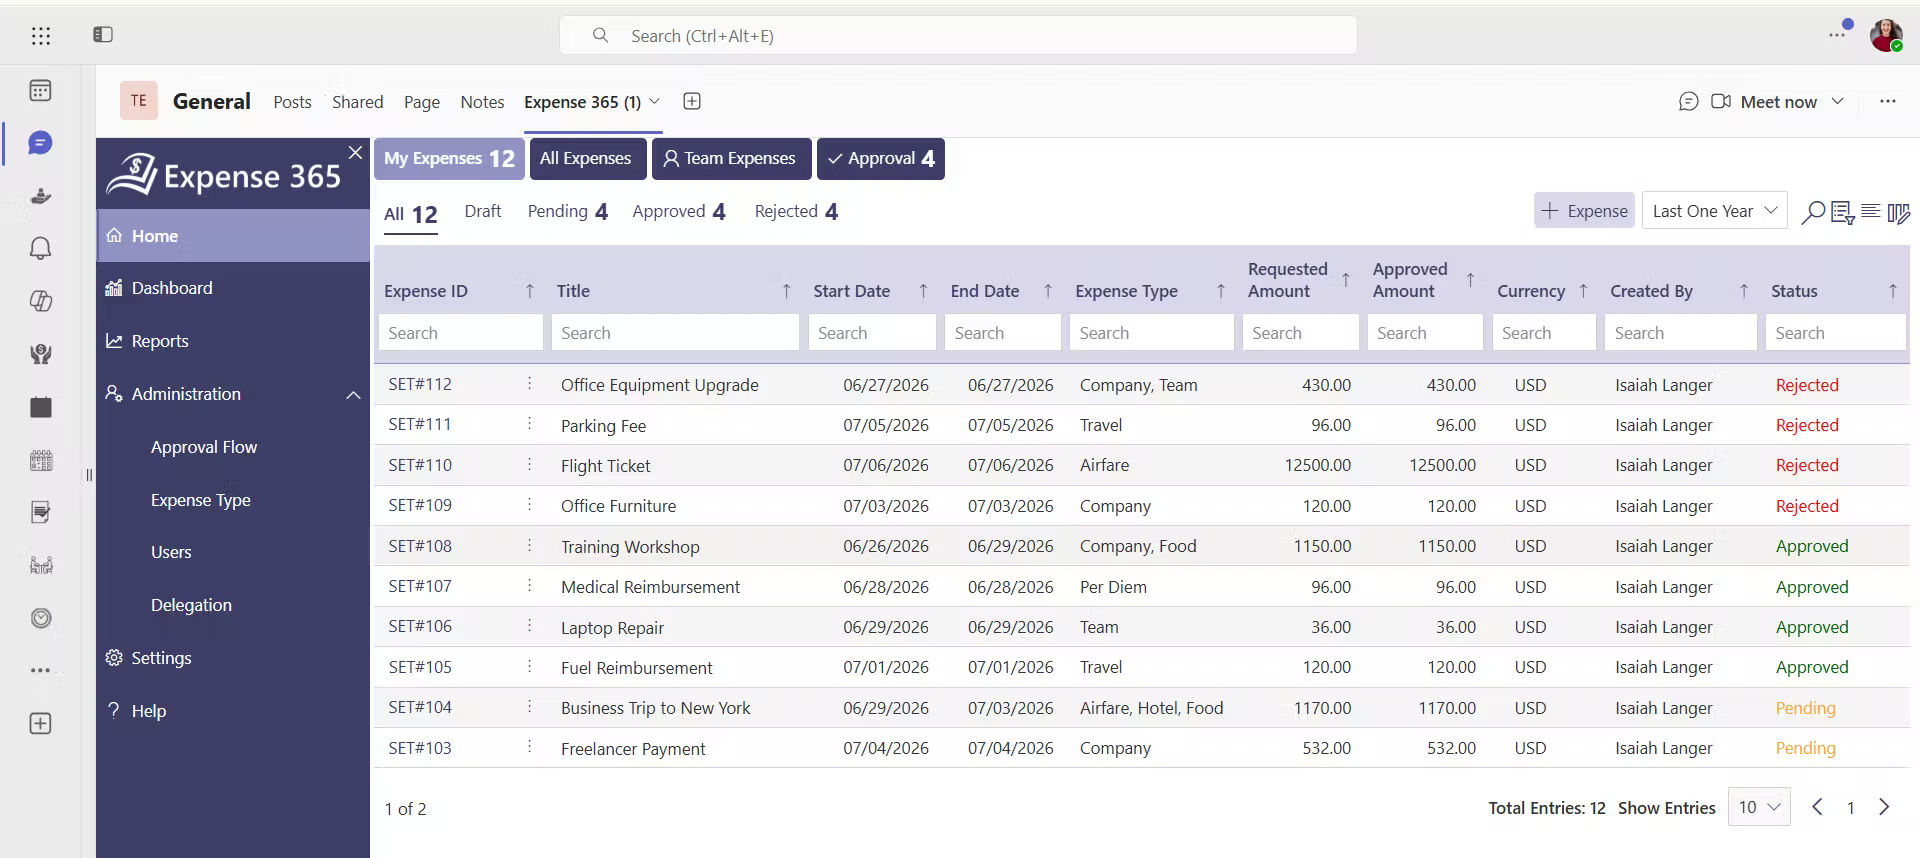
Expense categorization is where most of the value in the process comes from. Without it, a business only knows its total spend, not where that spend is concentrated or why. Common categorization methods include the following.
- By supplier: Grouping all transactions with a given vendor to spot consolidation opportunities and negotiate volume-based pricing.
- By department or cost center: Showing which teams spend the most and whether that spend matches their assigned budget.
- By expense type: Separating travel, software, meals, office supplies, and professional services into standard buckets.
- By spend classification: Sorting purchases into direct spend, indirect spend, and capital expenditure.
- By compliance status: Flagging spend that falls outside approved vendors or contract terms, often called maverick or off contract spend.
A standardized taxonomy, applied the same way every quarter, is what makes the whole exercise reliable over time. Without consistent categories, this quarter’s report cannot be fairly compared to last quarters, and trends become almost impossible to spot.
Important Metrics to Be Tracked During the Process
A spend analysis solution is only useful if it tracks the right numbers. These are the metrics that matter most for a finance team trying to change buying behaviour, not just produce a report.
- Total spend by category: The baseline figure that every other comparison is built on.
- Spend under management: he percentage of total spend that flows through approved procurement or expense channels versus spend that happens outside them.
- Maverick spend rate: Spend that occurs outside approved suppliers or contracts. According to The Hackett Group, organizations lose between 5% and 16% of targeted savings to this kind of off-contract, maverick buying every year.
- Cost per transaction: How much it costs, in staff time and processing fees, to handle one invoice or expense report from start to finish.
- Vendor concentration: The share of spend going to top suppliers, useful for spotting both risk and negotiation leverage at renewal time.
- Policy compliance rate: The percentage of expenses submitted correctly on the first pass, without corrections or follow-up questions.
- Savings realized: The actual dollar impact of changes made after a spend review, tracked against the previous period so the number means something.
Tracking these metrics consistently, month over month, is what turns a spend analysis exercise from a reporting formality into a tool that changes how people buy things.
Why Is Spend Analysis Important for Business?
Spend analysis directly affects a company’s bottom line, and the benefits go well beyond simple cost cutting.
Uncovers Hidden Spending Opportunities
Many businesses continue paying for duplicate software subscriptions, unused licenses, or purchases made outside approved contracts. A detailed spend analysis brings these hidden expenses to light, allowing organizations to eliminate unnecessary costs and make better use of their budgets.
Strengthens Vendor Negotiations
Accurate spending data gives procurement and finance teams stronger negotiating power. When businesses can clearly show how much they spend with a supplier across departments, business units, or locations. They are in a better position to negotiate volume discounts, favorable payment terms, and improved contract conditions.
Supports More Accurate Budgeting
Historical spending patterns provide a reliable foundation for future budgets. Instead of relying on estimates or repeating last year’s numbers, finance teams can allocate budgets based on actual spending trends by category, department, project, or vendor. This leads to more realistic financial planning and better resource allocation.
Reduces Compliance and Fraud Risks
Regular spend reviews make it easier to detect unusual transactions, policy violations, duplicate payments, and suspicious expense claims before they become larger problems. According to the Association of Certified Fraud Examiners (ACFE), organizations lose an estimated 5% of annual revenue to fraud each year, with expense reimbursement schemes averaging $251,000 per case and remaining undetected for about 18 months on average. Consistent spend analysis helps organizations identify these patterns earlier and strengthen financial controls.
Improves Financial Forecasting
Well-categorized spend data allows finance teams to forecast future expenses with greater accuracy. By identifying seasonal trends, recurring costs, and changes in purchasing behavior, organizations can create more reliable forecasts. This enables better budget planning and improves cash flow management.
Enables Better Business Decisions
Executives and department leaders make stronger decisions when they have complete visibility into organizational spending. Instead of relying on assumptions or fragmented reports, a spend analysis app provides clean, categorized data that helps leadership prioritize investments. This helps in controlling costs and align spending with business goals.
Reduces Supplier Concentration Risk
Spend analysis helps businesses understand how much they rely on individual suppliers. If a large share of spending is concentrated with one vendor, organizations can proactively diversify suppliers. This visibility also creates opportunities to negotiate better pricing, service levels, and long-term contract terms from a stronger position.
Smarter Spend Analysis Starts Here
Expense 365 brings spend analysis, real-time expense insights, category-wise reporting, and interactive dashboards into one place, built natively for Microsoft 365.
Common Mistakes That Happen During the Spend Analysis Process
Even well-intentioned spend analysis efforts run into the same recurring problems, year after year.
Relying on spreadsheets for everything
Manual spreadsheets get outdated quickly, break with version conflicts between team members, and demand constant upkeep that pulls staff away from higher-value work.
Inconsistent categorization
When departments label spend differently, a “software” expense in one team’s records might be logged as “IT services” in another, making company-wide reporting inaccurate and hard to trust.
Ignoring tail spend
Small, scattered purchases across dozens of vendors often add up to a meaningful share of total spend, yet they get overlooked because no single transaction looks significant on its own.
Treating spend analysis as a one-time project
A single spend review gives a snapshot, not a trend. Without repeating the exercise on a set schedule, businesses miss shifts in spend behavior until they become expensive to fix.
Not involving department heads
Finance can pull all the numbers it wants, but without input from the people actually approving purchases, the analysis misses the context behind why certain spend happened in the first place.
Skipping data validation
Duplicate entries, missing receipts, and mismatched currencies quietly distort totals if nobody checks the underlying data before the analysis begins.
Underestimating maverick spend
According to a joint study by WBR Insights, ProcureCon, and SDI, 91% of procurement leaders view maverick spend as a challenge, and 87% said it increased over the past year. Ignoring this category leaves real savings sitting on the table.
No clear ownership
When no single team or person owns the process, reports get produced on schedule, but nobody follows through on the recommendations inside them.
No clear ownership
When no single team or person owns the process, reports get produced on schedule, but nobody follows through on the recommendations inside them.
Spend Analysis Best Practices That Actually Save Time
Getting this right does not require a massive overhaul of every system a finance team already uses.
- Standardize your spend categories before you start: Agree on one policy across every department so reports compare fairly quarter to quarter, not just team to team.
- Automate data capture wherever possible: Manual entry is slow and prone to mistakes; automated receipt scanning and card feeds cut that risk substantially and free up hours every week.
- Review spend monthly, not annually: Smaller, more frequent reviews catch problems while they are still small and cheap to fix.
- Set a maverick spend threshold and track it: Decide what percentage of off contract spend is acceptable, then measure against it every single cycle.
- Give department heads visibility into their own numbers: Shared dashboards make people far more accountable for their own budgets than a year-end email ever will.
- Audit a sample of transactions regularly: Spot-checking receipts and invoices catches issues that automated rules alone might miss.
- Tie findings to actual policy changes: Data without action is just a report sitting in an inbox; close the loop by updating spend policies based on what the numbers show.
- Tie findings to actual policy changes: Data without action is just a report sitting in an inbox; close the loop by updating spend policies based on what the numbers show.
Expense 365: Make Expense Reports and Analysis Efficient
Expense 365 is built natively within Microsoft 365 to help organizations analyze, track, and optimize business spending from a single platform.
It automatically categorizes expenses and organizes spending data into meaningful reports. Interactive dashboards provide real-time visibility into spending patterns across departments, projects, vendors, and expense categories.
Finance teams can identify cost trends, monitor budgets, and uncover opportunities to reduce unnecessary spending. Detailed reports support more accurate forecasting and data-driven financial planning.
With all expense data centralized in Microsoft 365, organizations can make faster, more informed decisions while maintaining complete visibility into company-wide spending.
Keyways Expense 365 supports better spend management
- Automatically categorizes expenses by department, vendor, and expense type.
- Provides real-time visibility into business spending as transactions occur.
- Flags policy violations before they become compliance issues.
- Offers customizable dashboards and reports for deeper spend analysis.
- Integrates with accounting and ERP systems to eliminate duplicate data entry.
For finance teams that want a spend analysis solution built directly into their existing expense management workflow, Expense 365 replaces scattered spreadsheets and disconnected apps with one connected source of truth for company spend, updated as transactions happen rather than weeks later.
Conclusion
Spend analysis helps businesses control costs, improve budgeting, negotiate better with vendors, and make informed financial decisions. When done regularly, it turns spending data into actionable insights that support long-term growth instead of relying on assumptions.
Ready to Simplify Spend Analysis? Expense 365 helps finance teams capture, categorize, and analyse business spending from one centralized platform.
See how Expense 365 can help you take control of your business spending. Book a personalized demo today.
Frequently Asked Questions
How often should a company run spend analysis?
Most finance teams get the best results from monthly or quarterly reviews. Annual-only reviews tend to miss spend problems until they have already grown expensive to correct.
What is the main goal of spend analysis?
The main goal is to give a business a clear, accurate picture of where its money goes, so leaders can cut waste, negotiate better supplier terms, and plan budgets based on real data rather than rough estimates.
What is the difference between spend analysis and expense management?
Expense management focuses on the day-to-day process of submitting, approving, and reimbursing individual expenses. This broader practice looks at the bigger picture, reviewing all that expense data together to find patterns and savings opportunities across the whole business.
Can a spend analysis solution track spending by department?
Yes, A spend analysis solution categorizes expenses by department, cost center, or business unit, allowing finance teams to compare spending across the organization.
What types of expense data should be included in spend analysis?
Spend analysis should include expense categories, vendors, employees, departments, projects, transaction dates, payment methods, tax details, approval status, budgets, and reimbursement data.


_JiluXJRGNl.svg)