
What Is an Organizational Chart and How Does It Work in Modern Companies?

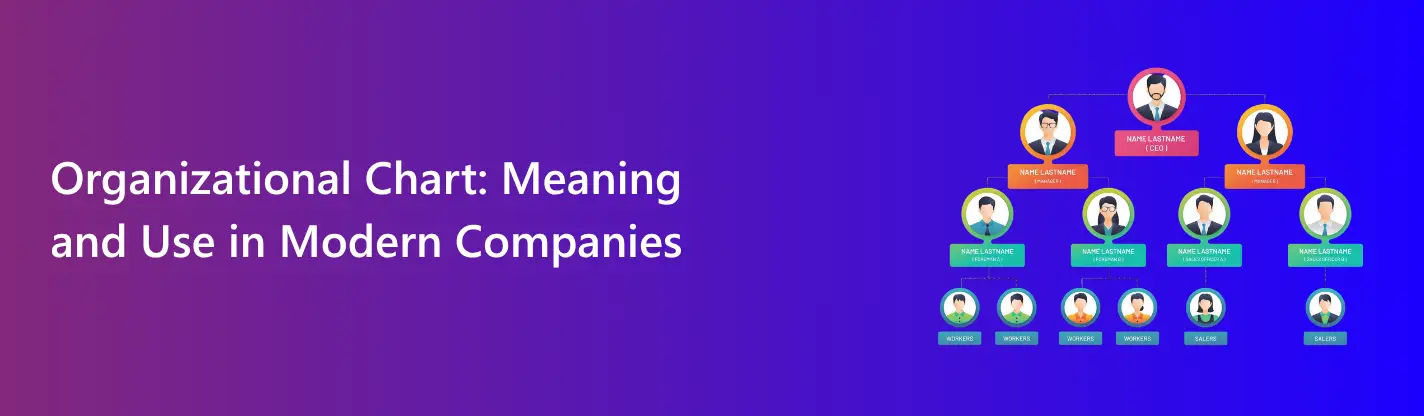
An organizational chart is a visual tool that shows how a company is structured. It uses simple boxes and lines to display job roles and reporting lines. Each box in the chart shows a person or position in the company. Lines connect these boxes to show who reports to whom.
This chart gives a clear view of how different teams and departments work together. It helps employees understand their roles and who they should reach out to for help or decisions. New employees find it helpful during onboarding as it makes the team structure easy to understand.
In today’s fast-moving and digital-first workplace, the organizational chart is more important than ever. Many teams work remotely or across different time zones. A chart helps everyone stay connected and know who is responsible for what. It also avoids confusion and makes employees communication smoother.
Companies that grow fast or change often need a clear structure. An org chart gives them the clarity they need to operate better. It supports managers in planning and helps HR teams track team size and roles. In short it brings order and direction to the way people work together.
Purpose of an Organizational Chart — Why Is It Important?
An organizational chart is more than just a picture. It is a tool that helps everyone in the company understand how the business runs. It shows how people are connected and how the work flows. A clear and simple chart brings structure and order to any company.
Let us look at the main reasons why an organizational chart is important.
1. Shows Who Reports to Whom
One of the main goals of an organizational chart is to show reporting lines. It tells you who your manager is and who reports to you. This helps reduce confusion about roles and responsibilities. When people know who they report to they also know who to contact for approval or support.
In large companies it becomes hard to remember everyone’s position. The chart makes it easy to see who is above or below in the chain. This supports clear decision making and faster communication.
2. Defines Responsibilities and Job Roles
Each box in the chart represents a job or role. The chart helps define what each person does. It also shows how their role connects to others in the team. This is helpful for managers as they can easily track tasks and roles across teams.
Clear job roles help avoid overlap. They make sure no work is left out or repeated. Employees feel more confident when they know what is expected from them.
3. Helps New Employees Understand the Company
For someone new in the company the organizational chart is a great starting point. It gives them a quick view of the structure. They can find out who works in which team and where they fit in.
This makes onboarding easier. New employees know who to reach out to for help. They also get a sense of how teams work together and what the company looks like from the inside.
4. Supports Communication and Teamwork
Good communication is key to a healthy workplace. An org chart helps people find the right contact quickly. Whether they need help from IT HR or sales the chart shows who is in each team.
It also supports teamwork. When everyone knows who is in charge and who their teammates are they work better together. It builds trust and helps avoid delays in tasks.
5. Guides Planning and Growth
Leaders use the organizational chart to plan for the future. It helps them see which teams are growing and which roles need to be filled. They can track team size and make decisions about hiring or restructuring.
The chart is also helpful during company changes. Whether it is a merger a shift in roles or a change in leadership the org chart keeps things clear. It shows the new structure in a way that is easy to understand.
6. Improves Transparency and Accountability
An organizational chart brings clarity. Everyone can see how the company is set up. There are no secrets about who holds which position. This improves trust among employees and helps build a strong work culture.
It also makes people more accountable. When roles are clearly defined and reporting lines are visible it is easier to track who is responsible for what. This helps in performance reviews and setting goals.
7. Useful for Remote and Hybrid Teams
In modern companies many people work remotely or from different places. An Microsoft org chart keeps everyone connected. Even if you do not meet in person you can still understand the team structure. This helps remote employees feel part of the company.
Researching organizational charts involves understanding how modern companies visualize roles, hierarchy, and reporting relationships to improve clarity and decision-making. Indeed’s guide on organizational charts, which provides practical insights into how they function in today’s workplaces.
Why Modern Businesses Use Organizational Charts
Companies grow quickly and teams work from different places. This creates a need for tools that help people stay connected and understand their roles. One such tool is the organizational chart.
Modern businesses use organizational charts to bring order and improve how people work together. These charts show job roles teams and reporting lines in a simple and visual way. Below are some key reasons why businesses rely on them today.
Onboarding Clarity for New Employees
Starting a new job can be confusing. New employees often struggle to understand who does what and who to talk to. An organizational chart solves this problem. It gives a clear view of the company structure.
When new hires can see where they fit and who their teammates are they settle in faster. They can also identify their manager and reach out to the right people for help. This builds confidence from day one and improves the onboarding experience.
In growing companies where new people join often a well-designed chart is a must. It saves time for HR and reduces the stress of learning everything from scratch.
Transparent Chain of Command
Every employee needs to know who they report to. A transparent chain of command makes this clear. Organizational charts show this in a simple visual way.
When employees know the reporting lines they also understand who makes decisions. This reduces workplace confusion. It helps avoid going to the wrong person for answers. It also supports respect for leadership and trust in the company process.
For managers a clear chain of command helps with team coordination. They can assign work better and track who is handling each task. This is key for day-to-day operations and long-term planning.
Faster Decision-Making and Accountability
Time is valuable in business. Decisions must be made quickly. Without structure decision-making slows down. People may not know who is in charge or who has the final say. This creates delays and mistakes.
Organizational charts help speed up this process. They show exactly who is responsible for what. Employees can take action without waiting for unnecessary approvals. Teams can also avoid stepping on each other’s work.
The chart also supports accountability. When a task is assigned it is easy to track who owns it. Everyone knows their role. If something goes wrong managers know where to look. This improves performance and builds a culture of responsibility.
Remote and Hybrid Team Collaboration Clarity
Modern companies often have remote or hybrid teams. Employees may work from different cities or countries. They may never meet face to face. This can lead to confusion about who is in which team and how the structure works.
An organizational chart helps remote teams feel connected. It gives them a clear view of the company. They can find names roles and contact details in one place. This helps in project coordination and daily communication.
For managers working with global teams the chart is a guide. It supports fair task distribution and better resource planning. It also helps remote workers understand how their role fits into the company mission.
How Organizational Charts Are Created Today
Creating an organizational chart is no longer a hard task. Today there are many ways to build one. You can use manual tools online software or even smart systems that update the chart on their own. Each method has its own use based on the size and style of your company.
No matter which method you choose the goal is the same. The chart must be clear easy to follow and always up to date. Let us look at how businesses create organizational charts in the modern world.
Manual Methods: PowerPoint and Excel
Many small teams still use simple tools like PowerPoint or Excel to create their org charts. These tools are easy to use and already available on most computers. You just add boxes lines and text to build the structure.
PowerPoint is good for making charts that you can show during meetings or training sessions. You can drag and drop boxes change colors and adjust layouts to fit your design. Excel works well when you want to use data tables and link them to visual shapes.
Manual methods are great for small teams or startups. But they can become slow and hard to manage as the company grows. Every time someone leaves or joins the team you must update the chart by hand. This takes time and can lead to mistakes if not done carefully.
Online Tools:
For larger teams or growing businesses online tools offer better options. SmartDraw Miro and Lucidchart are popular platforms used to create modern org charts. These tools offer templates and design features that make building a chart much faster.
SmartDraw is known for its drag-and-drop feature and large set of templates. It is often used by HR teams and business leaders who need fast results. Miro is a whiteboard-style tool where teams can build org charts together. It is very useful for remote teams who want to work on the chart at the same time. Lucidchart is another top choice. It offers cloud access and strong design features. You can also link your chart to data from other tools like Google Sheets or HR systems.
These tools make it easy to create charts that look good and are easy to read. They also let you share the chart with your team online. You can update the chart quickly and give access to others in real time.
Automated Methods: HR Software That Syncs with Org Changes
The best option for larger companies is to use HR software that builds the chart automatically. These tools connect with your company database and create a chart based on employee database. When someone joins or leaves the company the chart updates on its own.
This saves time and reduces errors. HR tools like BambooHR Zoho People and other platforms have built-in org chart features. These tools pull job titles departments and reporting lines directly from employee records.
Automated charts are very helpful for companies that grow fast. They give real-time updates and reduce the need for manual work. They also help during audits and planning as the data is always current and correct.
Key Tip: Keep It Simple and Up to Date
No matter which tool you use always keep your chart simple. Use clear job titles and clean lines. Avoid adding too much detail. The chart should be easy to read at a glance.
Also make sure the chart is always up to date. An outdated chart can cause confusion and reduce trust. Assign someone in HR or operations to update it often. When people move roles or leave the company the chart must show that change.
The Role of Org Charts in Remote and Hybrid Teams
People work from home from different cities or even different countries. This setup brings many benefits but also some challenges. One of the biggest challenges is keeping everyone connected and informed.
This is where an organizational chart helps. It gives structure to a team that may never meet in person. It shows who is doing what and how people are linked. A good org chart keeps remote and hybrid teams organized and aligned.
Visibility for Global Employees
When teams are spread across locations it can be hard to know who is part of the company. Remote workers often feel left out because they do not see their coworkers every day. An organizational chart gives them a clear view of the entire team.
With an org chart employees can see the full structure of the company. They can look up names job titles and departments. This helps them feel connected even if they are working far from the main office. It also helps them understand how their role fits into the bigger picture.
Visibility builds trust. It shows remote staff that they are part of the team. It also makes the company feel open and easy to reach.
Clarity in Asynchronous Environments
In remote and hybrid setups people often work in different time zones. They may not be online at the same time. This is called asynchronous work. It is common in global teams.
In such settings quick communication is not always possible. You cannot always ask your manager for help right away. An org chart acts as a guide. It shows who handles which task and who you can contact when needed.
This makes it easier to plan your work. It also reduces delays. If one person is offline you can look at the chart and find someone else in the same team. The chart helps people work on their own without waiting too long for answers.
Helps New Hires Understand Who’s Who
New employees often find it hard to know who is in the team. This is even harder in remote jobs. They may never get to meet their team in person. Without guidance they can feel lost.
An org chart makes onboarding easier. It shows new hires where they fit in. They can see their manager their teammates and people in other departments. This helps them learn names and roles faster.
The chart also answers common questions. Who is the head of HR? Who works in sales? Who do I contact for IT help? All this is easy to find with a well-made chart. It removes guesswork and builds confidence from the start.
Reference Point for Responsibilities and Project Ownership
In a hybrid team it is important to know who is doing what. Without face-to-face meetings tasks can get mixed up. An org chart helps solve this problem.
The chart shows clear roles and reporting lines. It helps everyone understand who owns each task. When working on a project you can look at the chart to see who is leading and who is supporting.
This helps avoid confusion. It also improves teamwork. Everyone knows their job and who to reach out to for updates. This is key when you cannot just walk to someone’s desk.
Managers also benefit from this. They can assign work based on team structure. They can also spot gaps and make smart hiring decisions.
Best Practices for Maintaining Your Org Chart
Creating an organizational chart is a smart step for any business. But building the chart is just the beginning. To make it useful the chart must stay accurate and easy to access. A chart that is old or confusing can cause more harm than good.
Here are the best practices to follow when managing your org chart. These steps will help keep your team informed and your structure clear at all times.
Make It Accessible to Everyone
An org chart should not be locked away or hidden in one folder. Everyone in the company needs access to it. This includes full-time staff part-time employees and remote team members.
When the chart is easy to find it saves time. People can check names job titles and reporting lines without asking others. It also helps new employees understand the structure of the team right away.
Use cloud-based tools or your company intranet to share the chart. Place the link in your onboarding guides team channels or HR dashboard. This makes sure that anyone can view it when needed.
Review and Update Monthly or Quarterly
People change roles leave the company or join new teams. When this happens the org chart must be updated. A chart that is not current leads to confusion and mistakes.
Set a regular time to review the chart. You can do this every month or every quarter based on the size of your company. During this review check if all names job titles and reporting lines are still correct.
If you wait too long small changes can build up and become hard to track. A steady update cycle keeps your chart clean and useful. You can also link the chart to HR software that updates data automatically. This helps reduce manual work and saves time.
Assign Ownership (Usually HR or Operations)
A chart needs someone to manage it. Without clear ownership updates will be missed. This job should go to a team or person who understands the company structure well.
Most companies assign this task to HR or operations. These teams know when someone joins leaves or moves to another team. They are also part of the onboarding process and can keep the chart in sync with changes.
Make sure the owner of the chart has the right tools and access. Give them a simple way to receive updates from managers. You can use forms emails or direct messages to share updates. Keeping this process smooth will make the task easier for everyone.
Keep It Aligned with Real Reporting Lines
The chart must reflect how the company works in real life. Sometimes companies create charts that look good but do not show the real reporting structure. This can confuse employees and lead to wrong decisions.
Talk to team leads and department heads before making big changes. Confirm who reports to whom and which teams are linked. Avoid guessing or using outdated job titles.
Also be careful with dotted lines and matrix roles. These can be useful, but they must be shown clearly. If someone has two managers, the chart should show that in a simple way. This helps everyone understand shared responsibilities.
If the chart matches real workflows, it becomes a trusted tool. People will use it often and rely on it for their daily work.
Common Mistakes to Avoid in Organizational Charts
An organizational chart is a great tool when done right. It shows how people work together and who reports to whom. But if not handled well it can cause confusion and even harm teamwork. Many companies make simple mistakes that take away the value of the chart.
Below are some common mistakes to avoid. Keeping these in mind will help you create a chart that is clear easy to use and truly helpful for your team.
Making It Overly Complex or Cluttered
One of the biggest mistakes is trying to show too much. Some charts include too many details or long job titles. Others try to add extra shapes colors and notes that are not needed.
A good org chart should be simple and clean. Each box should show the name, the job title and maybe the department. That is enough for most teams. If your chart looks crowded, people will not want to use it.
Avoid adding extra charts or sub-layers unless they are really needed. Use simple lines to show reporting and keep the layout easy to follow. A chart should give answers not create more questions.
Forgetting to Update After Internal Changes
An outdated org chart is as bad as no chart at all. Teams grow. People leave. Roles change. If you forget to update the chart it becomes useless.
Employees may look at the chart and try to contact someone who no longer works there. Or they may report to the wrong person based on what the chart shows. This creates delays and breaks trust.
Make chart updates part of your company routine. Update it every month or at least every quarter. If possible link it to your HR system so changes happen automatically. When the chart stays current it becomes a reliable guide for everyone.
Excluding Temporary or Contract Workers
Many teams include people who are not full-time employees. These can be contractors freelancers or consultants. Leaving them out of the chart is a mistake.
Even if they are not permanent they are still part of the team. Other employees need to know who they are what they do and who they report to. This helps in planning meetings sharing tasks and solving problems faster.
You do not need to give them the same space as full-time staff. You can use a different color or section. But they should still appear on the chart. It shows respect for their work and makes teamwork easier for all.
Not Making It Visually Intuitive
Even a simple chart can fail if it is hard to read. Using unclear fonts strange layouts or poor color choices can confuse users. A chart should be easy to read at a glance.
Keep the layout vertical or horizontal. Use standard fonts and readable sizes. Choose soft colors that make it easy to spot different teams or levels. Do not use dark or bright colors that strain the eyes.
Also avoid using long job titles or large photos. They take up space and make the chart look crowded. Keep everything short and to the point.
Think about how the viewer will use the chart. Can they find names fast? Can they follow lines easily? If yes, then the design is working well.
How Org Charts Reflect Company Culture and Values
An organizational chart is more than a map of job roles. It also reflects the company’s culture and values. The way a business builds and shows its org chart says a lot about how it works and what it believes in.
Some companies follow a strict chain of command. Others prefer open teamwork across roles. Some focus on clear steps for promotion while others focus on team growth. These ideas often show up in how the org chart is designed.
Let us explore how different styles of org charts match different company values.
Rigid vs Fluid Structures
A rigid structure often shows a top-down chart. At the top you see the CEO then department heads and finally the team members. This type of chart fits companies that value control and order. It works best in places where roles do not change much and tasks follow set steps.
This does not mean a rigid structure is bad. It brings clear rules and helps large teams stay organized. But it may limit flexibility.
A fluid structure looks different. You may see fewer levels and more shared lines. This setup fits companies that value teamwork and quick change. These businesses give more power to teams and adjust roles as needed.
A fluid chart often works well in startups or creative companies where ideas move fast and people wear many hats.
Transparency vs Hierarchy
Some charts are open and easy to access. Everyone in the company can see who reports to whom. This builds trust and shows that the company believes in fairness. A transparent chart helps new hires learn fast and keeps communication clear.
Other charts may hide some layers. Only senior staff can view the full structure. This may fit companies with strict roles or sensitive teams. But it can also lead to confusion and poor teamwork.
If a company wants open communication and trust it should keep its chart simple and shared. This sends a strong message that every role matters and every person is part of the bigger mission.
Cross-Functional Alignment = Modern Agility
Modern companies often work in cross-functional teams. This means people from different departments join to work on a single project. A traditional chart may not show this well.
To reflect agility some charts now include dotted lines or grouped roles. These show how a person may report to more than one manager or be part of several projects at once.
This type of chart fits companies that focus on speed and customer needs. It supports fast action and team-based decisions. It also shows that the company values skill sharing over title or rank.
An org chart that shows these links tells staff that working together is more important than sticking to fixed boxes.
Org Charts as Storytelling Tools for Company Vision
A chart can tell a story. It shows not just where the company is today but also where it wants to go. For example if a company adds a new team to the chart it signals growth. If new roles appear for diversity or digital tasks it shows what the company values.
Colors shapes and layout can also tell a story. A flat chart shows equality. A chart with new roles in training shows focus on learning. A separate team for innovation shows the value placed on future thinking.
When shared during onboarding or meetings the chart becomes a way to explain the company’s goals. It tells employees how they fit into the mission and what their role means in the bigger picture.
Conclusion
An organizational chart is a simple tool that shows how a company works. It helps teams see roles understand reporting lines and stay connected. In modern companies where remote and hybrid work is common a clear chart is more important than ever. It supports better planning faster decisions and stronger teamwork. Tools like Employee Directory 365 make it easy to build and manage org charts that stay updated as your team grows. Whether your business is big or small a good org chart brings structure and clarity that helps everyone do their best work.
Frequently Asked Questions
What is an organizational chart?
An organizational chart is a simple visual that shows job roles and reporting lines in a company.
Why do companies need an org chart?
It helps teams understand structure supports clear communication and guides new employees.
How often should we update our org chart?
You should update it every time there is a role change or at least once a quarter.
Can remote teams use org charts?
Yes remote teams need org charts to stay connected and know who handles what.
How can Employee Directory 365 help with org charts?
Employee Directory 365 builds and updates org charts automatically using your Microsoft 365 data.